

How to use the “Analysis Mode” and Copilot features in Business Central effectively
We would like to introduce one of the useful features in Microsoft Dynamics 365 Business Central – Analysis Mode – and its extension thanks to Microsoft Copilot integration. These tools allow you to quickly and efficiently get an overview of your data, perform advanced analyses and work with data directly in the system without the need to export to Excel.
What is the “Analysis Mode” function?
The “Analysis Mode” function is used to analyse data directly in the Business Central environment. It allows you to transform any list into an interactive environment where you can create contingency tables, set filters, make calculations and reorganise data to suit your needs. This function is ideal for users who need fast and accurate reports without tedious manual processing.
How do you use the function?
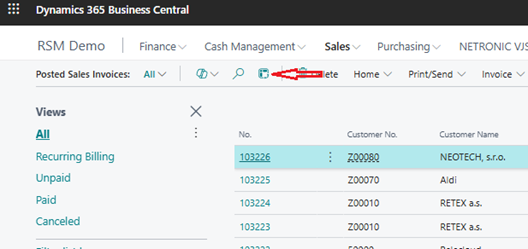
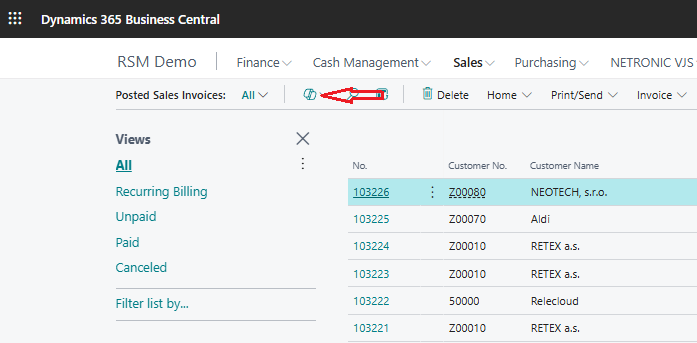
- Open any list in Business Central (e.g. posted sales invoices).
- Click on the “Analysis Mode” icon located at the top of the screen (see image below).
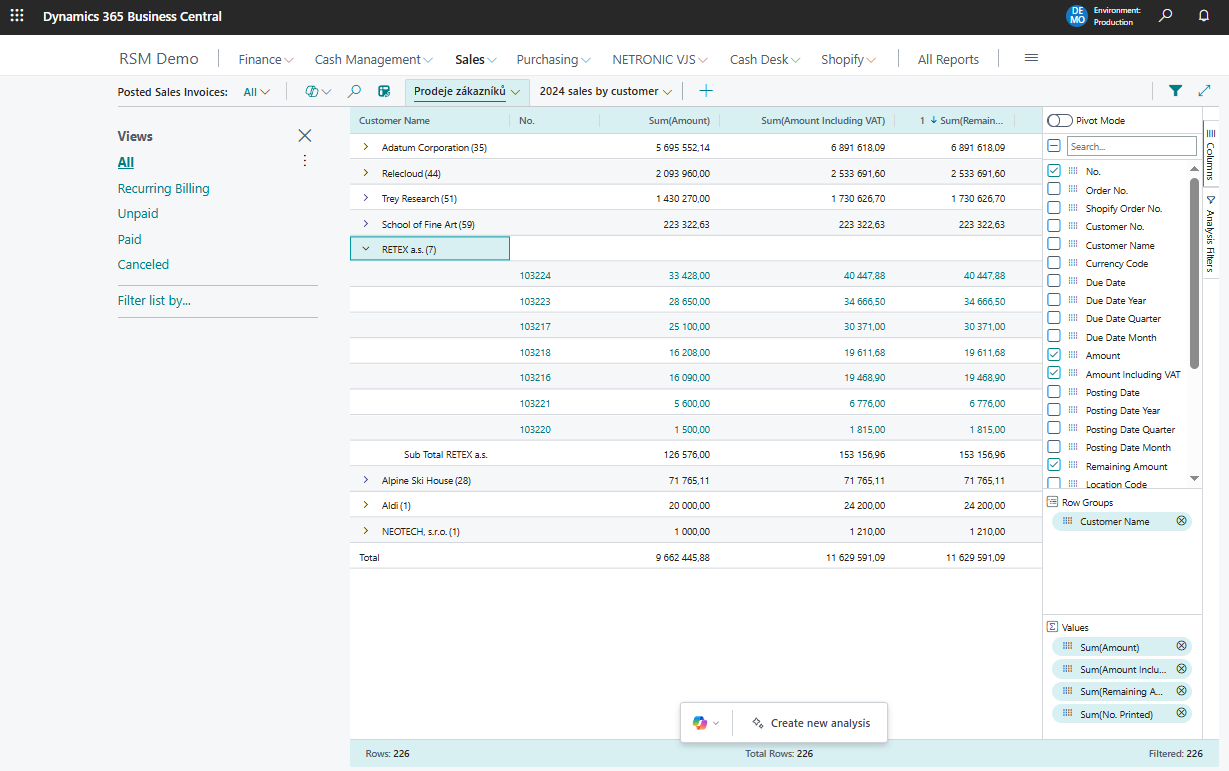
- The system automatically opens an interactive analysis mode, where you can:
- Add columns and rows.
- Set filters to display only relevant data.
- Perform calculations such as sums and averages.
- Create contingency tables directly in the system.
Microsoft Copilot: AI assistant for data analysis
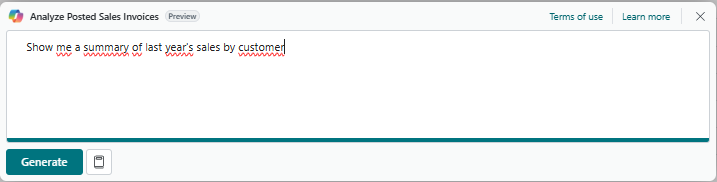
With the integration of Microsoft Copilot, working with analyses using the “Analyse List” function becomes even easier. Copilot is an AI-powered assistant that allows you to analyse data using simple text queries. Just describe what you need, e.g.:
- “Show me a summary of last year’s sales by customer.”
- “Sort the invoices by amount from highest to lowest.”
Copilot automatically creates a draft contingency table or other type of analysis according to your requirements. This allows you to:
- Quickly identify trends and anomalies in your data.
- Get reports without having to manually set up filters or sorting.
- Save time on reporting and decision making.

Practical examples of use:
- Analysis of sales invoices: Find out which customers are generating the most sales or analyse payment trends. With Copilot, you can simply enter a request such as “Create a sales chart by region”.
- Inventory overview: Export a list of products and track their availability or turnover. Copilot can help you identify products with low availability by asking “Find products with a turnover rate of less than 10 per month.”
- Financial reports: Create clear financial analyses based on data from accounting modules. For example, using the query “Calculate the average time to pay invoices for the last year.”
Benefits of combining analysis and Copilot functions
- Speed: You can analyse data directly in Business Central without exporting.
- Simplicity: Copilot helps you create analyses based on your text queries.
- Flexibility: The interactive interface makes it easy to change the view of the data to suit your current needs.
- Efficiency: Save time when creating reports thanks to Copilot’s automatic suggestions. The analyses that are created are saved on the overview page, and you can return to them at any time.
Tips for effective work:
- Before using the feature, set up filters in Business Central so that the exported data contains only what you need.
- Experiment with different combinations of rows and columns to get new views of your data.
- Use Copilot to predict future trends such as sales or inventory.
The “Analyse List” feature with Microsoft Copilot allows you easily to combine the power of Business Central with modern analytical tools.
Try them today and simplify your daily work with data!